Links
Concept
Group Project for Full-stack Frogs (that's the team name) was to create a mood/workload tracker to allow a manager to monitor their team's wellbeing. A team member was to log their mood and workload every week, whilst a manager can view a dashboard containing aggregated data logged by their team members.
Kudos to the frontend team for making this really pretty.
Notable Features
When a normal user logged in, they're shown the 'Pulse' check in form. But when a manager logged in, they're shown a dashboard containing data visualisations of their team's logged data. This required setting up different user roles and permissions in the backend, and then ensuring that the frontend displayed the correct information based on the user's role. Below are screenshots, for user and manager respectively.
-
Login Page
One logon page for both user and manager. Backend returned whether the user was a manager, and frontend displayed the appropriate view based on that information.
-
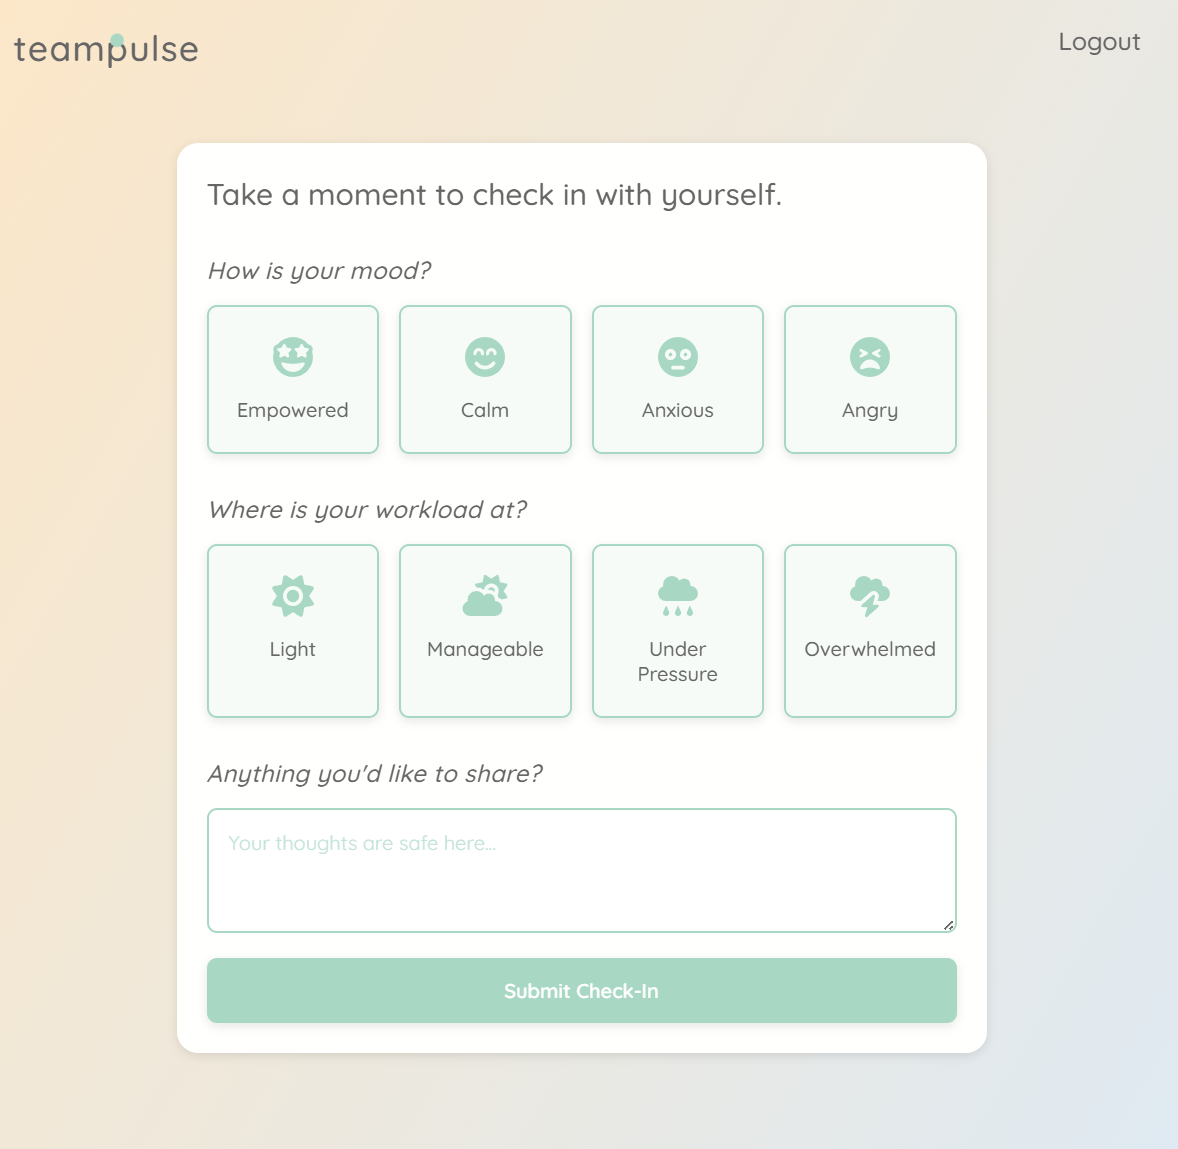
Home Page (General Mode)
Check-in form for user. Frontend designed this page with simplicity and usability in mind.
-
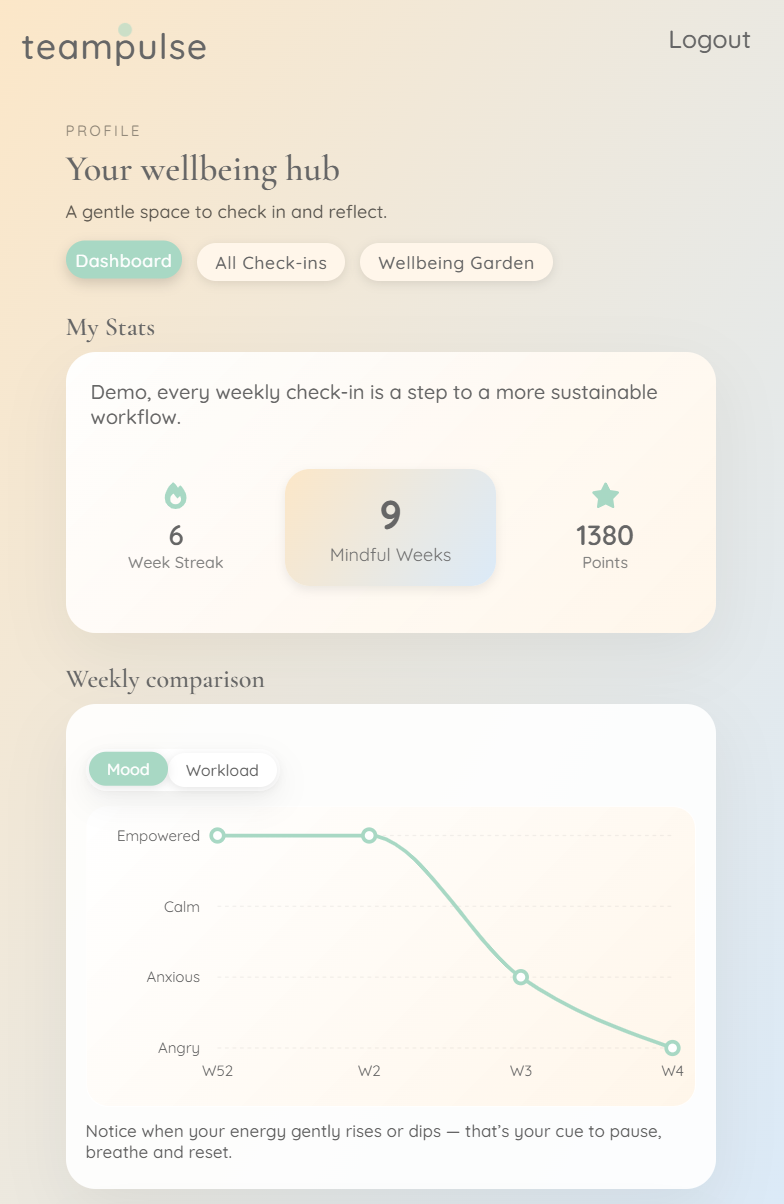
User Dashboard
This was what a user would see after completing their check-in. The page would show their current user points and a graph representation of their recent check-ins.
-
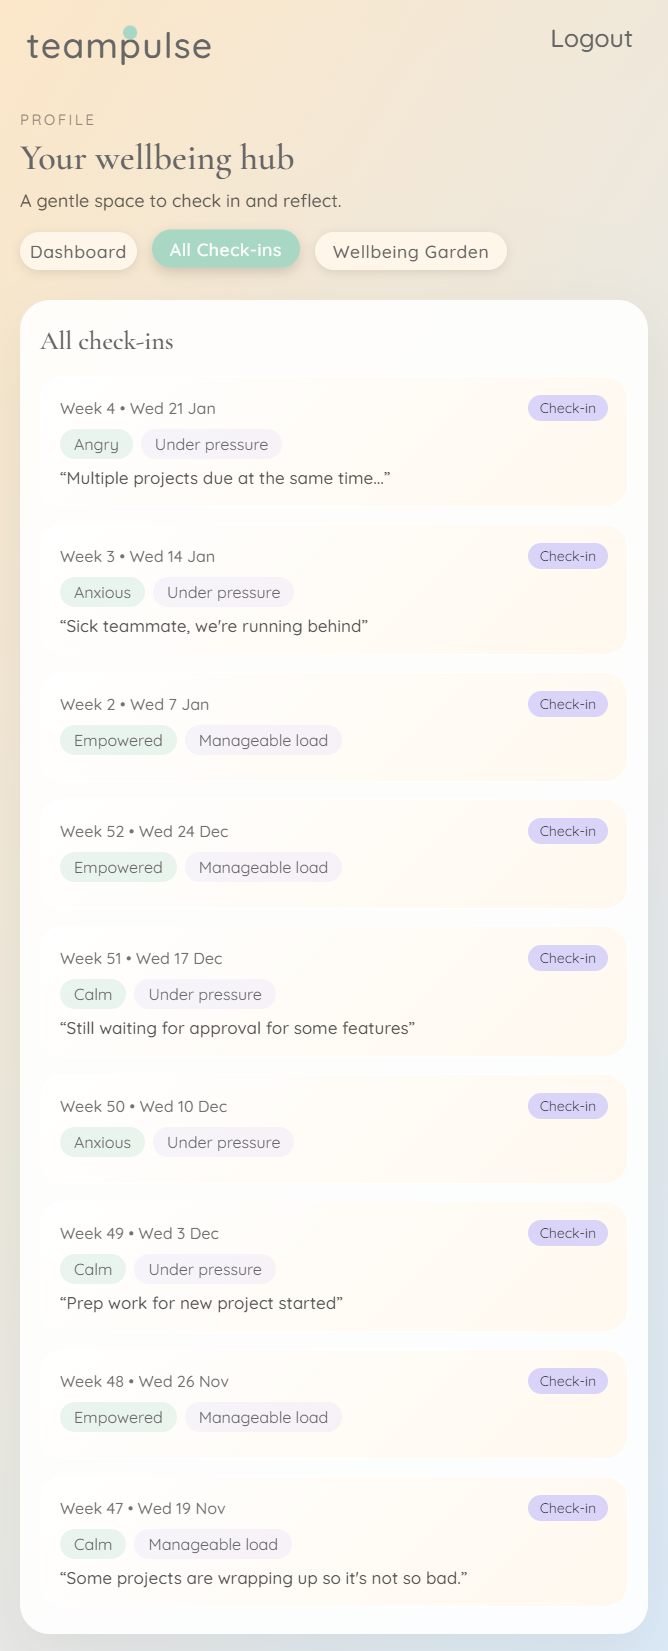
User Dashboard - Details
This page showed more detail for the user's check-ins, showing more data and user comments.
-
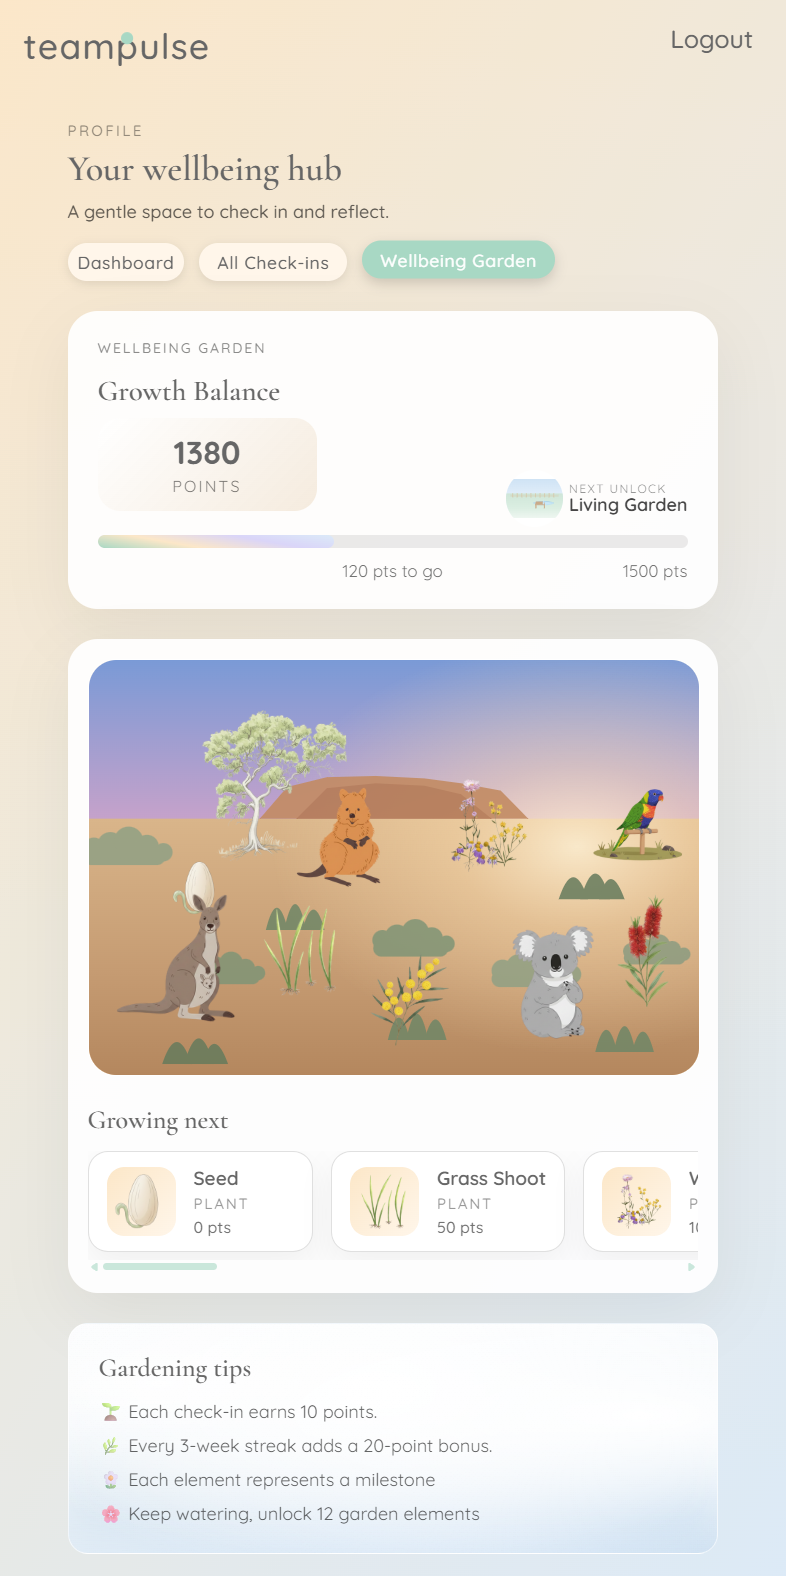
User Incentives
This page showed the user's current points balance and their unlocked incentives.
-
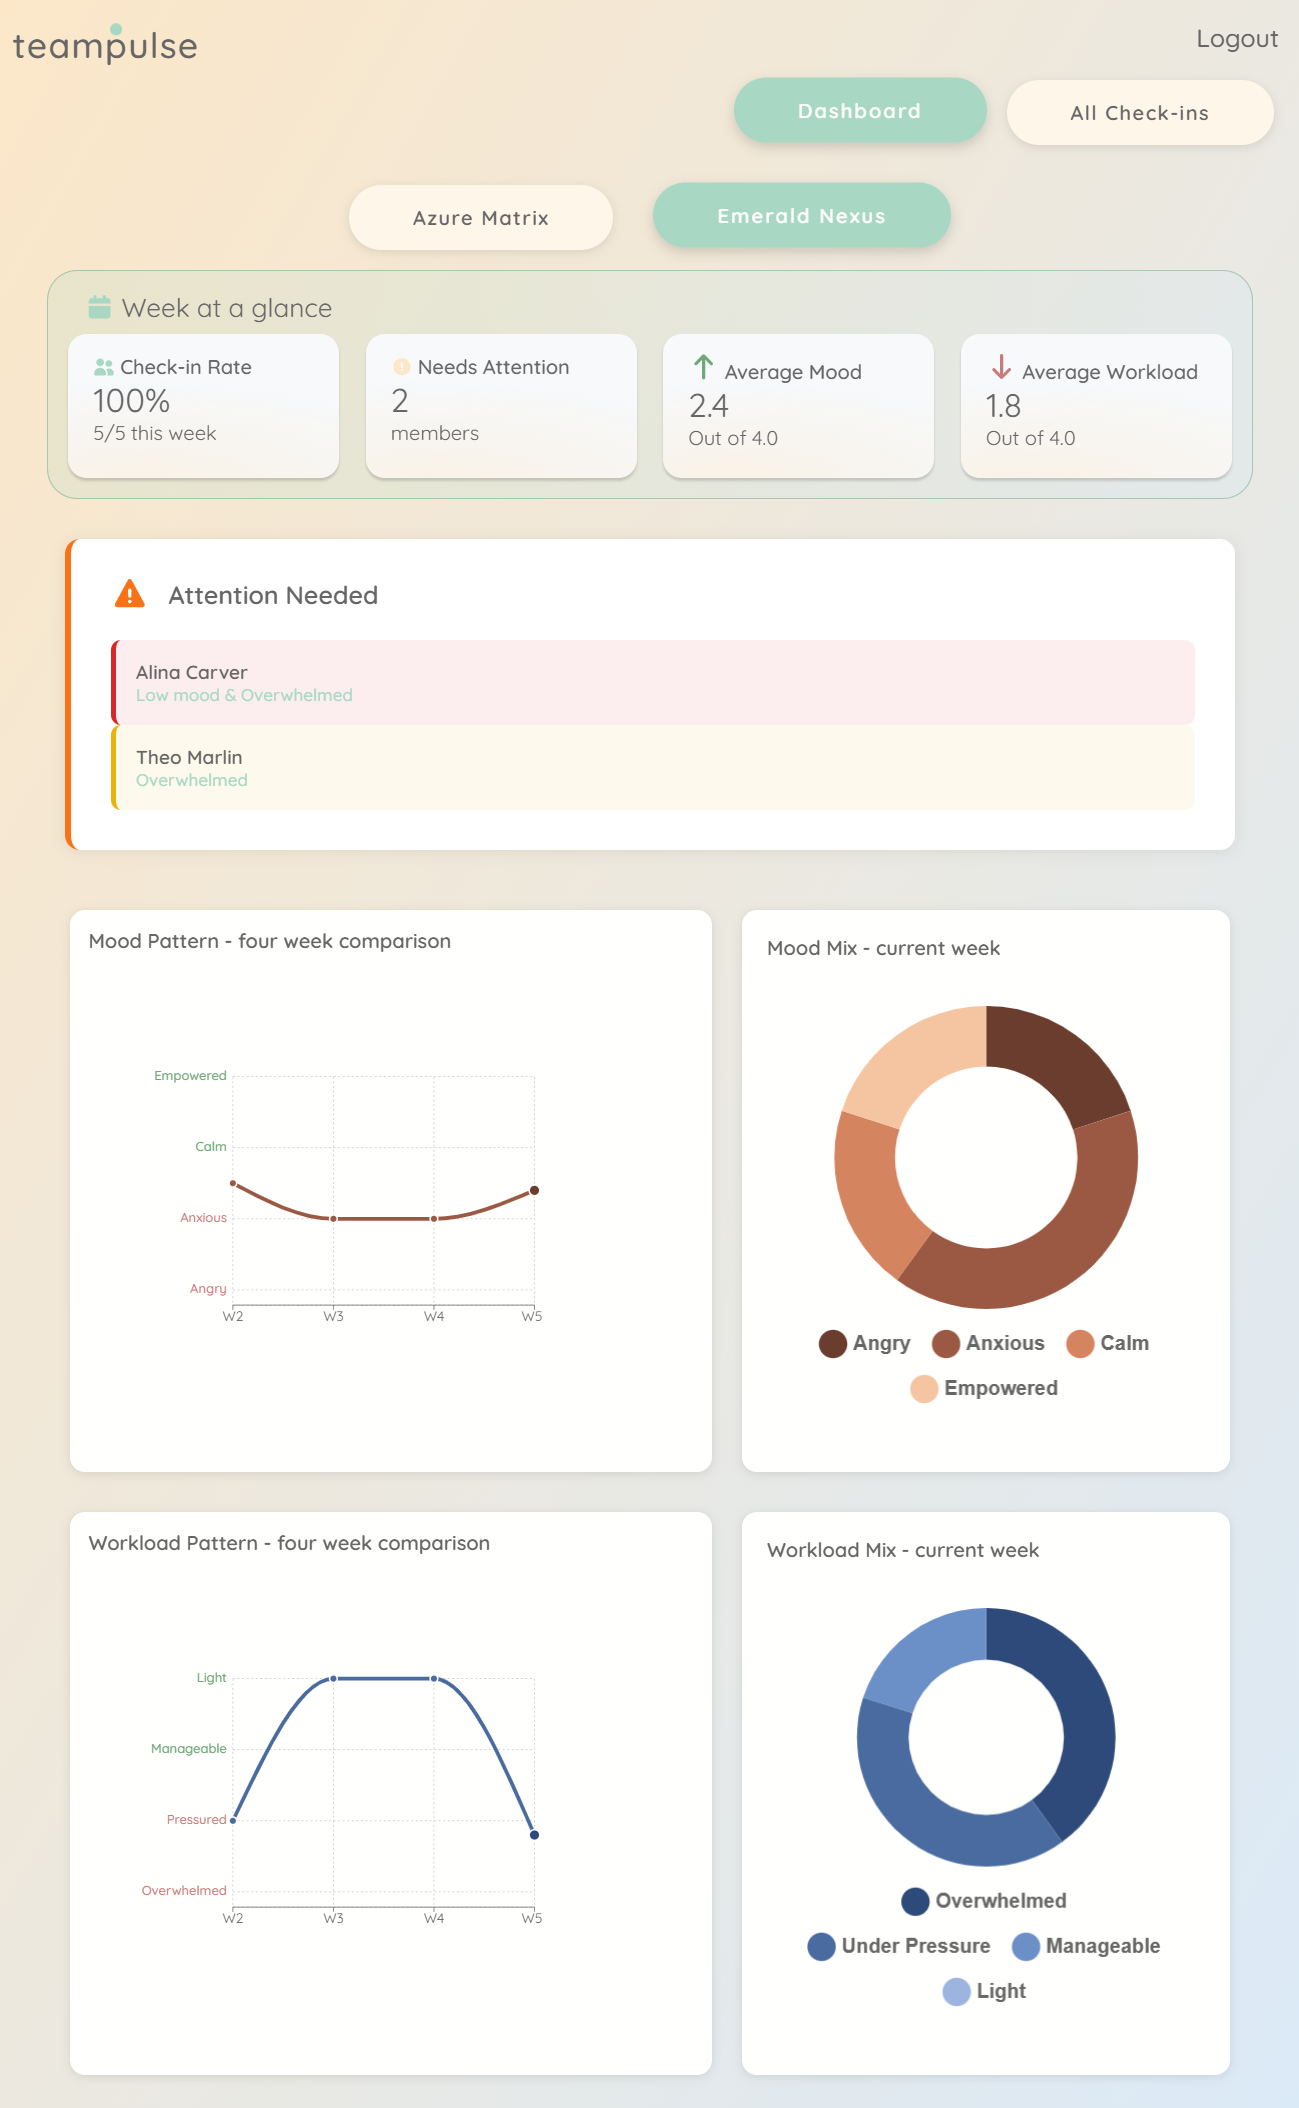
Manager Dashboard
This was the manager's main view. It shows a summary of all teams they managed, the team's participation rate, trend and whether any team member required assistance. Manager could filter by team, and could only see the team they managed.
-
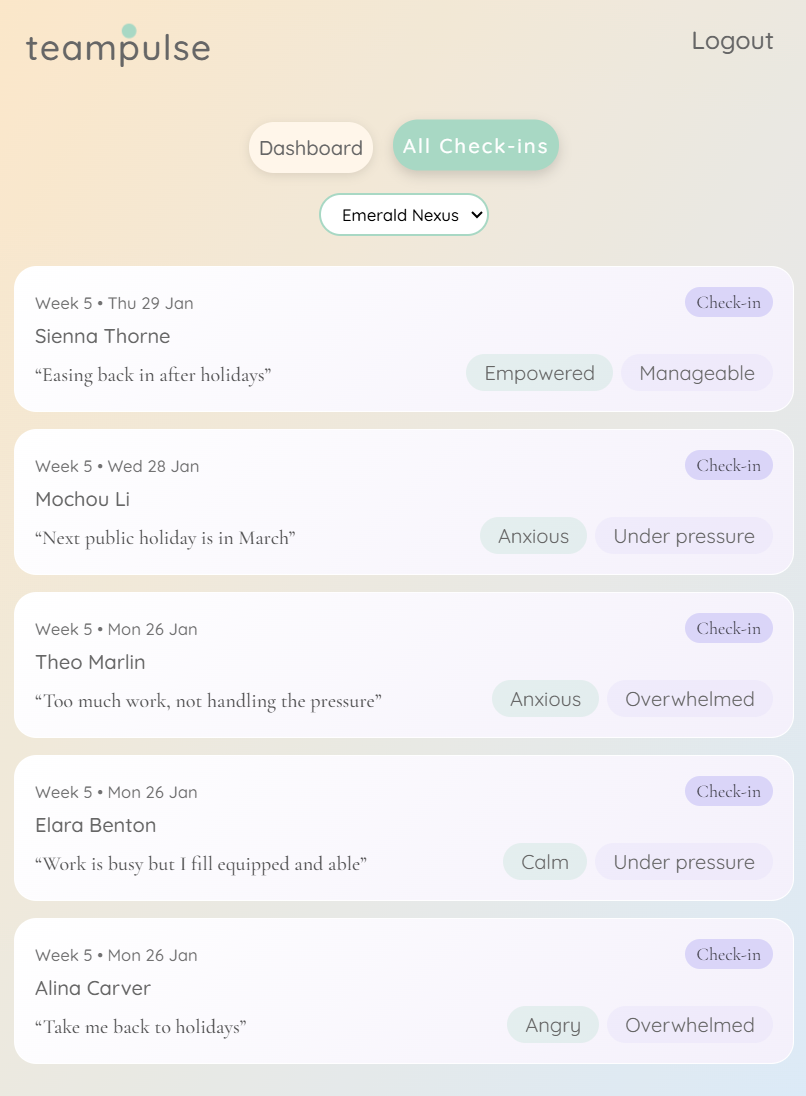
Manager List View of Team Pulse
This page showed check-in details which the manager could filter by team.
Challenges
I can only write about challenges faced by the backend, as I chose to not contribute to the frontend.
Weekly Limitations
Notable challenge was in ensuring that a team member can only log their data once a week, defining what a 'week' meant, and in displaying the data segregated by team as a manager can manage multiple teams. Discussions we had around this topic was centred around timezones, and what would be defined as a "week". 2 people on opposite ends of the globe could be logging their Pulse at the same time, and yet for one of them it's Sunday night and for the other it's Monday morning. Should the data be logged against separate weeks?
Adding to the complexity was that whilst Python (the backend) had built in library to determine what the current week index was, JavaScript (the frontend) did not. This meant that we would had to implement this in the front end, and frankly it was beginning to get very complicated. In the end, we decided to let the frontend simply send the current date and time to the backend, and let the backend determine if the user had already logged their Pulse for the current week.
The design for the database changed as well to accomodate this weekly check. Originally we were only going to store the timestamp and calculate the week index on the fly, but this would had meant more calculations and checks every time a user tried to log their Pulse. Instead, we decided to store the week index along with the timestamp, so that checking if a user had already logged their Pulse for the week would be a simple database query. This also made it easier to manipulate data for demo purposes, to generate more data than what was realitically possible within the time frame of the project.
Limiting The Number of Pulse Logs
Another challenge was in determining how much data to return to the front end. If we used an example of 20 active users each logging their Pulse every week, over a year that's over 1000 entries. If a manager had multiple teams, this number could easily double or triple. Returning all this data to the front end every time a manager wanted to view their dashboard would be inefficient and slow.
To solve this, the POST method was written to accept optional parameter of weeks_total, which would limit the number of weeks of data returned. So if a manager only wanted to see the last 4 weeks of data, they could specify weeks_total=4 in their request, and the backend would only return the relevant data. The method was also written to ignore any week for which there was no data lodged. This significantly reduced the amount of data being sent over the network, improving performance and user experience.
Incentives/Gamification
To encourage users to log their Pulse regularly, an incentives system was implemented. Users would earn points for each Pulse logged, with bonus points for consecutive weeks of logging. As this feature was implemented fairly late, it was too complicated to implement this logic in the backend and doing back calculations for data that had already been logged. We agreed to implement this logic in the frontend instead, relying on the front end to do the calculation and telling the backend what points to update the user record to.
This was not ideal as it opened up the possibility of users manipulating their points by sending false data to the backend. However, given the time constraints and the complexity of implementing this logic in the backend, we ignored this risk. Future iterations of the project could look into implementing this logic in the backend to ensure data integrity.
One notable feature was the POST method. We overloaded the POST method to create a new user_points record if none existed for a given user_id. Otherwise, it would update the existing record with the new points value. This was done with the aim of making sure that there was ever only 1 record for each user_id.